

Hardware Marketing ROI Measurement Demystified

How engineer founders can measure hardware marketing ROI on gross profit, not revenue, and track which campaigns lead to profitable sales.
The Core Framework for Hardware Marketing ROI Measurement
When a launch falls flat, sales fade after launch, or buyers cannot understand your product, ROI measurement helps you see which marketing efforts lead to profitable sales. Start with what your product helps buyers do, then use technical specifications to support that promise.
To measure hardware marketing ROI, take gross profit credited to marketing and subtract all marketing costs, including ads, production, tools, and staff. Divide the result by that same total marketing investment. Before calculating the return, subtract cost of goods sold (COGS), logistics, warranty reserves, and channel fees from revenue. Count each cost only once. If you spend $50,000 on ads to generate $100,000 in revenue for a device with 80% COGS, the remaining $20,000 does not cover your ad spend.
When engineer founders build physical products, they look at unit economics, bill of materials (BOM), and factory yields. Yet when evaluating marketing, many fall back on vanity metrics like impressions, clicks, or raw lead counts. Hardware marketing economics differ from pure software. Every physical unit shipped carries direct manufacturing, shipping, and warranty costs. Measuring marketing return based solely on top-line revenue leads to distorted projections.
To compare campaigns by their financial contribution, base hardware marketing ROI measurement on gross profit credited to marketing rather than revenue alone.
| Metric Component | Revenue-Based Calculation (Inaccurate) | Profit-Based Calculation (Hardware Standard) |
|---|---|---|
| Marketing Spend | $50,000 | $50,000 (Fully Loaded) |
| Generated Revenue | $150,000 | $150,000 |
| COGS & Direct Costs (60%) | Not Factored ($0) | $90,000 |
| Net Gross Profit | $150,000 | $60,000 |
| Formula Result | ($150k - $50k) / $50k = 200% ROI | ($60k - $50k) / $50k = 20% ROI |
| Executive Outcome | False sense of profitability | Shows profit after marketing costs |
As highlighted in Siemens Advanta's research on how to accurately calculate ROI in IOT, calculating financial impact means tracing how an activity affects business results and including all operating costs, not just estimating revenue.
Defining Net Profit vs Top-Line Revenue in Hardware ROI
Finance and marketing must agree on which sales to credit to marketing and which costs to subtract. Revenue alone does not show whether those sales made money.
When calculating the return on marketing, subtract the following from revenue before running your return ratios. Do not subtract a cost again if it is already included in COGS:
- Cost of Goods Sold (COGS): Direct bill of materials, factory assembly, and direct labor per unit.
- Logistics & Freight: Inbound freight, warehousing, fulfillment, and tariffs.
- Warranty and Return Reserves: Estimated costs for warranty claims and product returns.
- Payment Processing & Channel Margins: Credit card fees, retailers' share of each sale, or distributor discounts.
Use data analysis for marketing to account for the operating costs that reduce profit from each sale.
Fully Loaded Marketing Cost Accounting
The denominator of your ROI formula requires equal discipline. Many companies calculate marketing returns using only direct media spend (such as Google Ads or LinkedIn Ads). This creates an artificial return figure that collapses once executive leadership reviews the full profit and loss statement.
Fully loaded marketing costs include:
- Direct Media & Distribution Spend: Paid search, paid social, print placements, sponsored newsletters, and display advertising.
- Creative & Technical Production: Product photography, 3D industrial rendering, interactive CAD viewers, video production, and packaging graphic design.
- Tooling and Infrastructure: Specialized pre-launch marketing tools, prototype display fixtures, demo units sent to enterprise prospects, and software subscriptions.
- Events & Field Marketing: Trade show booth space (such as CES, Automatica, or AUVSI), freight, booth assembly, travel, and onsite hospitality.
- Team Costs: Internal marketing team compensation, contractor fees, and agency partner retainers.
Accounting for all marketing costs helps finance and marketing compare reports on the same basis.
Multi-Touch Attribution Models for Long Hardware Sales Cycles
Hardware sales cycles rarely happen in a single browser session. Whether you sell enterprise edge servers, robotics modules, or developer hardware kits, buying decisions can involve several people and review stages over many months.
A prospect might first discover your product via an organic search article, visit your booth at an industry trade show three months later, download a 3D CAD step file five months later, and finally submit a Request for Quote (RFQ) through an executive referral. Relying on simple single-touch attribution models (first-touch or last-touch) obscures which initiatives actually moved the deal forward.
Use data driven marketing strategies to track the interactions a buyer has with your team before a sale. Circana’s research on identifying which media campaigns provide the highest ROI value examined how campaigns affected premium and non-premium hardware sales. Consider effects across product categories when comparing campaign budgets.
Account-Based and Position-Based Attribution Models
Position-based models assign sales credit to selected buyer interactions. Account-based models group interactions from people at the same company.
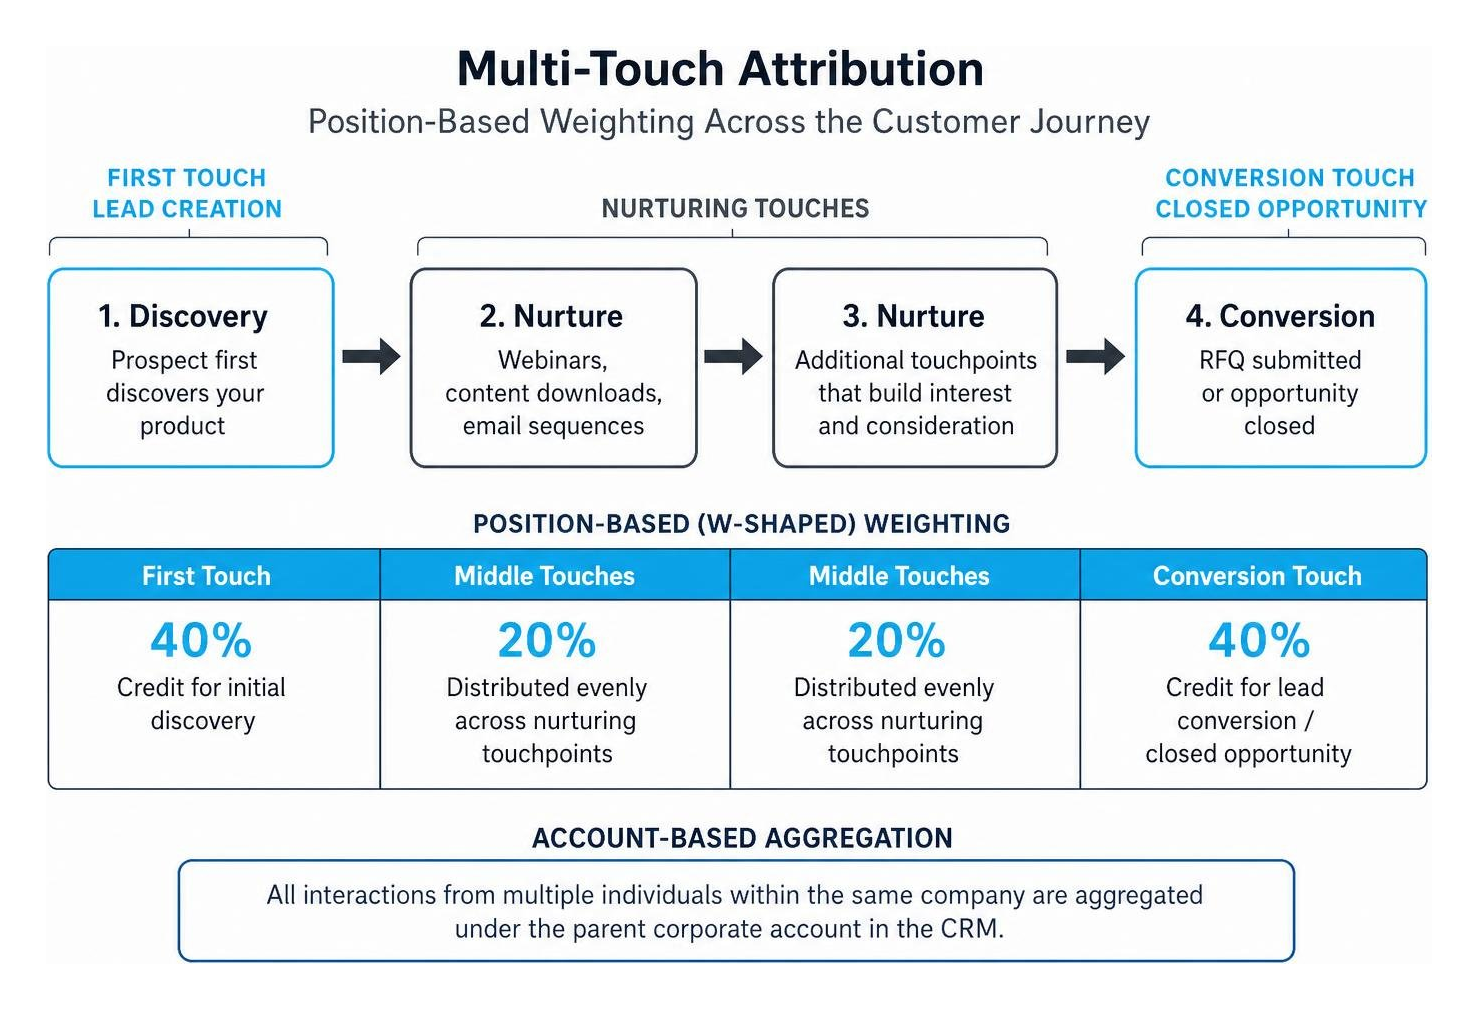
- Position-Based (40-20-40 / U-Shaped): This model gives 40% of the credit to the first interaction, when a buyer discovers your product. It gives another 40% to lead conversion, such as submitting an RFQ or contacting sales. The remaining 20% is split evenly among interactions in between, such as webinars, spec sheet downloads, and emails.
- Account-Based Aggregation: In B2B hardware, several people from the same company may review your materials. An electrical engineer downloads the pinout sheet, a procurement manager checks warranty terms, and a VP of Engineering reviews compliance documents. Account-based attribution groups these interactions under the company account in your customer relationship management (CRM) system rather than treating each person as a separate lead.
Use advanced marketing analytics to group activity by account while still tracking what each buyer does.
Overcoming Attribution Pitfalls in Hardware Marketing ROI Measurement
Three common errors frequently compromise hardware marketing attribution:
- Changing Attribution Models Mid-Year: Constantly adjusting how you assign sales credit makes it harder to compare results over time. Keep the same attribution rules for at least four consecutive quarters where practical. Document any necessary changes so reports remain comparable.
- Missing Private Sharing and Word of Mouth: Technical buyers may share PDF whitepapers, spec sheets, and product links in private Slack groups, Discord servers, and internal emails. Add an open-ended question to your RFQ forms: "How did you first hear about us?" Compare these answers with your digital tracking to find gaps.
- Failing to Reconcile Offline and Channel Conversions: Marketing may generate demand that independent sales reps or distributors fulfill. Use structured marketing campaign tracking to connect offline deal registrations to the earlier digital campaigns that generated the leads.
Key Metrics Beyond ROI: Sales Opportunities, Sales Speed, and Customer Lifetime Value
Marketing ROI shows the overall financial return. To manage campaigns each month, also track measures you can act on before a sale closes. Waiting for completed sales can leave little time to adjust a campaign before its budget runs out.
Track key performance indicators (KPIs) for marketing to see how sales opportunities progress. CAD downloads and RFQ submissions can signal buyer interest earlier than page views.
Commercial Metrics: RFQs, Win Rate, and Pipeline Velocity
To diagnose where revenue momentum accelerates or stalls, measure these core pipeline metrics:
- Request for Quote (RFQ) Volume and Cost per RFQ: Track how many RFQs meet your team's technical and sales criteria. Divide the total marketing cost by that count to see what each qualified RFQ costs.
- Pipeline Velocity: This estimates the value of sales opportunities moving through your pipeline per day. The formula is:
Pipeline velocity = (number of qualified opportunities × average deal size × win rate) ÷ sales cycle length in days
Buyers who understand your product specifications before speaking with sales may need less time to evaluate it. A shorter sales cycle increases pipeline velocity when the other factors stay the same. Use consistent tracking marketing performance across these stages to see where deals stall.
Long-Term Customer Lifetime Value and Payback Periods
Hardware profit can extend beyond the first unit shipped. Include relevant follow-on purchases when estimating customer lifetime value: add-ons sold after the initial purchase, accessories, recurring firmware licenses, and spare parts.
Include all relevant marketing and sales costs when calculating customer acquisition cost (CAC). Compare that cost with the gross profit you expect over the customer relationship, or lifetime value (LTV). Set an LTV-to-CAC target that fits your margins and cash needs. Use gross profit, not revenue, to calculate LTV.
Connecting Marketing, Sales, and Finance Data
To measure marketing return accurately, your marketing automation platform, CRM, and financial accounting systems must use the same names and definitions for campaigns, customers, and sales.
Set clear rules for who maintains customer and campaign data and how errors are corrected. Use performance marketing tracking software to help keep tracking data consistent across systems.
Connecting marketing data directly to CRM-tracked deal stages prevents marketing teams from reporting isolated lead metrics that bear no relation to actual booked orders.
Connecting Website Activity to Sales and Order Records
Connect a buyer's first interactions with recorded sales in four steps:
- Use Consistent Tracking Tags: UTM tags are labels added to links to identify the traffic source, channel, and campaign. Use consistent tags in ads, press links, and your own channels. Add hidden fields to quote and contact forms so they automatically save those tags and Google or Microsoft ad click IDs (GCLID/MSCLKID) in the CRM lead record.
- Group Contacts by Company: Match contacts to their company using work email domains and tools that add company details such as industry and size.
- Sync Orders and Payments: Connect your CRM, such as Salesforce or HubSpot, to your enterprise resource planning (ERP) or inventory system, such as NetSuite or SAP. When a hardware purchase order is fulfilled, send the actual invoice amount, serial numbers, and return adjustments back to the CRM opportunity record.
- Track Interactions Across Channels: Use tracking software for performance marketing to record buyer interactions. Check that connected systems do not create conflicting marketing and accounting records.
Agreeing on Sales Responsibilities and a Shared Report
Data architecture alone cannot fix misaligned teams. If sales claims marketing generates unqualified leads while marketing claims sales fails to follow up on high-intent inquiries, ROI reports lose credibility.
- Review Revenue Together Each Month: Bring together the CEO, VP of Sales, Head of Marketing or marketing partner, and Finance Controller once per month to review a shared sales and marketing report.
- Agree on Lead Criteria and Follow-Up Times: Define what makes a Marketing Qualified Lead (MQL), a Sales Accepted Lead (SAL), and a Sales Qualified Opportunity (SQO). Agree on how quickly sales will respond to inbound RFQs, for example, within 2 hours for enterprise inquiries.
- Combine Reports from Sales Channels: If you sell both online and through physical distribution networks, use retail marketing performance tracking to combine sales reports from independent retailers.
Practical Playbook for Hardware Marketing ROI Measurement
Follow this structured sequence to implement a reliable hardware marketing measurement system:
- List All Marketing Costs: Catalog direct media spend, creative production, agency fees, trade show costs, and software tools to calculate your total marketing costs.
- Use Consistent Tracking Labels: Use the same UTM naming rules and form fields across landing pages, documentation portals, and distributor materials.
- Connect CRM to Invoicing Systems: Use actual invoice and payment records to check closed-won deals, rather than relying on contract estimates. Account for return reserves and hardware COGS when calculating profit.
- Set Up Position-Based Attribution: For each CRM opportunity, give 40% of credit to the first interaction, 40% to lead conversion, and split the remaining 20% among interactions in between.
- Keep Attribution Rules Consistent: Keep the same weighting rules across four full quarters where practical so you can compare results over time. Document any necessary changes.
- Check Reports with Finance Each Month: Work with finance to compare sales opportunities credited to marketing with the accounting records at the end of each reporting period.
- Move Budget Based on Profit: Shift spending from weaker channels to campaigns with higher gross profit after marketing costs. Consider pay for performance marketing, where payment depends on agreed results, when it fits your business.
Frequently Asked Questions about Hardware Marketing ROI
How does hardware marketing ROI differ from ROAS?
Return on Ad Spend (ROAS) measures revenue generated per dollar spent on advertising (ROAS = gross revenue ÷ direct ad spend). It does not subtract COGS, shipping, tooling, agency retainers, or overhead. Hardware marketing ROI starts with gross profit credited to marketing, subtracts all marketing costs, and divides the result by those same marketing costs. Keep the cost scope consistent across reports.
How often should hardware marketing ROI be reported and recalibrated?
Track operational metrics, such as cost per RFQ, conversion rates, and channel click-throughs, weekly and monthly to adjust live campaigns. Calculate fully loaded marketing ROI quarterly to align with accounting close schedules. Keep the same attribution model for twelve months where practical so you can compare results over time. Document any changes to the model.
How can hardware companies measure ROI when distributors own the end sale?
When distributors handle the sale, website tracking may stop before checkout. Use distributor deal registrations and unique promotion codes for market development fund (MDF) campaigns. For each territory, compare shipments to distributors (sell-in) with their sales to customers (sell-through), using point-of-sale (POS) data. Offer online warranty registration to buyers. Each quarter, compare partner lead claims with sales records to see which campaigns led to profitable sales.
Conclusion
Measuring hardware marketing ROI means connecting campaign spending to manufacturing costs, gross profit, and completed sales, not just clicks or lead counts. When engineer founders combine total marketing cost accounting with tracking across buyer interactions, they can better see which campaigns contribute to profitable sales.
At CRISPx, we plug in as the founder's marketing and sales team, so you do not need to hire an internal head of marketing. Whether you are preparing to launch or growing after launch, our subscription plans, Launch, Grow, Grow + Ads, and Scale, provide marketing and sales support to help buyers understand and choose your product.
Our approach is guided by proven industry experience:
- Tony Crisp has 30 years in branding, 100+ hardware launches and 8+ patents, and co-founded AViiQ (acquired).
- Robosen Optimus Prime went from Kickstarter to CES, then Hasbro and Disney licenses.
- XFX became NVIDIA's #1 graphics card partner worldwide and went public.
- FuzeDrive ran a top 1% Indiegogo campaign.
- SecureCircle was acquired by CrowdStrike.
- Element U.S. Space & Defense serves clients like Anduril, SpaceX and NASA.
We use The DOSE Method™ as a strategy framework to help technical founders connect product messaging with buyer needs:
- Diagnosis: Find what's broken in your messaging, positioning, or sales tracking.
- Prescription: Fix the biggest marketing problem first.
- Prognosis: Set targets for qualified sales opportunities, track results, and adjust campaigns.
Ready to evaluate how your messaging, marketing, and sales efforts perform? Get a free DOSEscore™ brand checkup to review your own website and story, or book a strategy call with our team.
Get a free brand checkup.
We work like a brand doctor. The DOSE Method™ finds what's broken, fixes the biggest problem first, then tracks the results.